Block group vs. tax parcel: which geographic unit fits a heat vulnerability map
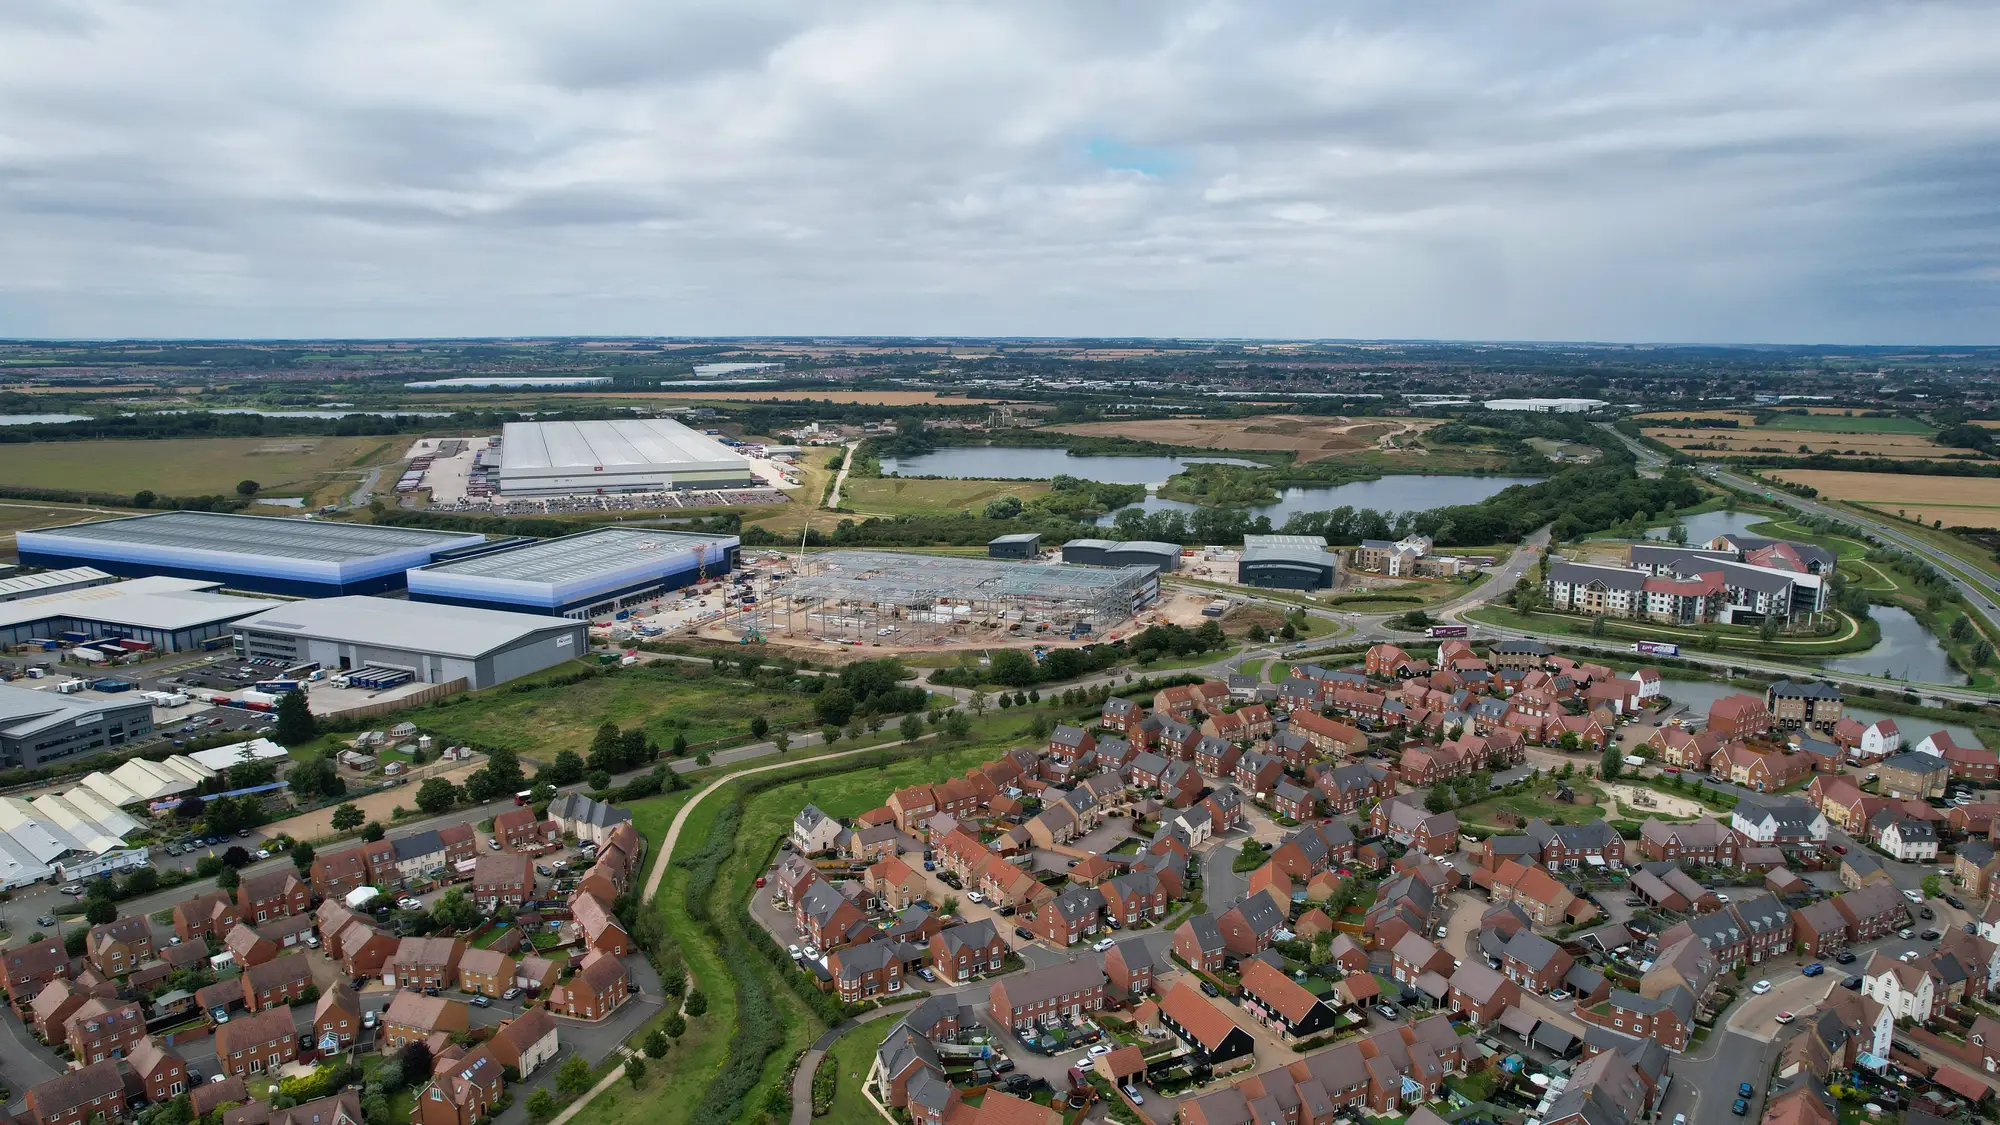
Before anyone pulls a surface temperature layer or builds a demographic overlay, there's a scoping question that decides how the whole project behaves: what's the unit of analysis? Most heat vulnerability work in local government ends up choosing between the census block group and the tax parcel, and the choice isn't cosmetic. It changes what the map can tell a council member, a cooling-center siting committee, or a shade-tree crew.
What a block group gives you
A census block group is a Census Bureau geography, typically running 600 to 3,000 people, built to carry American Community Survey data: median age, income, disability status, language isolation, housing tenure. If your heat vulnerability index leans on social indicators, the block group is where that data lives natively. No translation layer, no modeling to push tract-level estimates down to a smaller footprint.
The tradeoff is size and shape. A block group can span a stretch of single-family homes, a strip of commercial frontage, and a slice of a highway interchange, all averaged into one polygon. Surface temperature inside that boundary can vary by several degrees block to block. You get a defensible demographic picture and a mushy thermal one. For a countywide equity report, that's often fine. For deciding which specific blocks get the next round of cooling-center funding, it starts to work against you.
What a parcel file gives you
A tax parcel is the opposite problem in reverse. Pull the assessor's parcel layer and you get real resolution: building footprint, roof material in some counties, lot coverage, year built, sometimes air conditioning status if the assessor records it for valuation. A thermal band overlaid on parcels points straight at the exact row of buildings running hottest, not a loosely bounded neighborhood guess.
What parcels don't carry is who lives there. Assessor data describes the property, not the household. You can't pull an elderly-resident count or a no-vehicle-household rate off a parcel file, because that's not what parcels are for. Matching parcels to demographic data means spatial joins, apportionment assumptions, and a margin of error that grows with how unevenly population is distributed across a block. A planning team doing this by hand on a few hundred parcels is one thing. Doing it citywide, every season, is a different project entirely.
Picking the unit for cooling investment
The practical answer most environmental health departments land on is neither one alone. Block groups carry the vulnerability side of the index: who's old, who's isolated, who doesn't have a car to get to a cooling center. Parcels, or a finer grid built from building footprints, carry the exposure side: which structures and surfaces run hottest this August. The two get joined, and the resulting unit is smaller than a block group and more consistently shaped than a parcel, usually something closer to a street segment or a tight cluster of parcels sharing a surface temperature signature.
That's the level cooling-tree and cooling-center siting decisions get made at. A council district is too coarse to argue for a shade canopy on one street over another. A single parcel is too narrow to justify a capital investment. The block, in the plain sense of the word, is where the thermal data and the demographic data have to meet before a budget line gets drawn around it.
The index logic in most heat vulnerability projects is usually fine. What stalls them is the upkeep: reconciling a parcel file that updates on the assessor's schedule against an ACS pull that's a year or two stale, every single season, by hand. Heat Exposure Mapping is built around that specific join: surface temperature, building type, and demographic density overlaid at block-level resolution, refreshed on a seasonal cadence, so the unit you're targeting cooling investment at stays consistent from one budget cycle to the next.
If you're scoping a heat vulnerability map and trying to settle the geography question before the funding request goes out, it's worth seeing what that block-level overlay looks like for your city.