Heat Exposure Mapping / blog
Blog
16 Nov 2026
 field notes: the block that cooled four degrees and nobody noticed until the data did
A field note on a block that cooled four degrees with no ribbon-cutting behind it, and what that says about tracking heat at block scale.
16 Nov 2026
 Surface urban heat island vs canopy urban heat island: what's the difference
Surface UHI and canopy UHI measure two different things. Here's what each one tells a planner siting cooling centers and shade trees by block.
9 Nov 2026
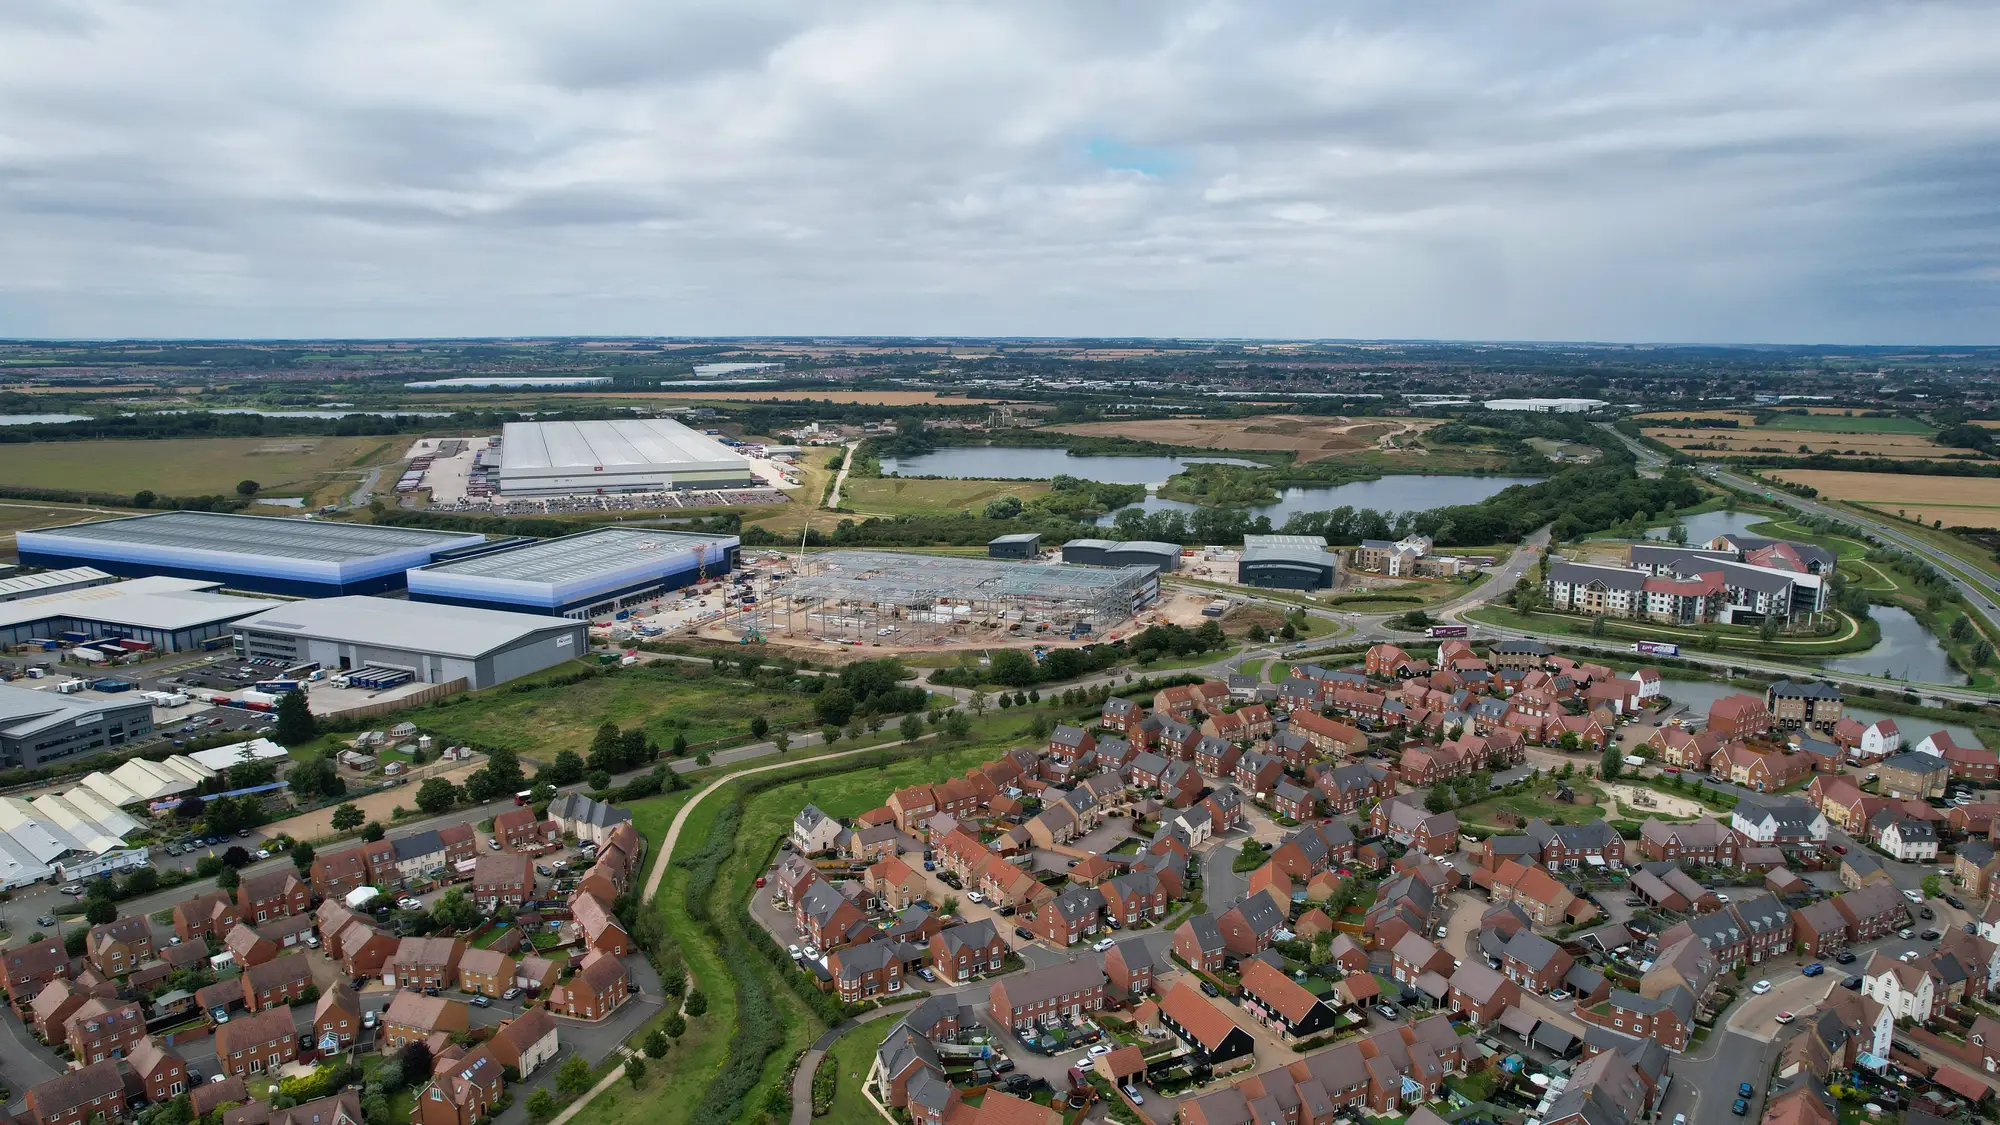 Block group vs. tax parcel: which geographic unit fits a heat vulnerability map
Census block groups and tax parcels answer different questions about heat risk. Here's how each holds up when you're siting cooling investment.
9 Nov 2026
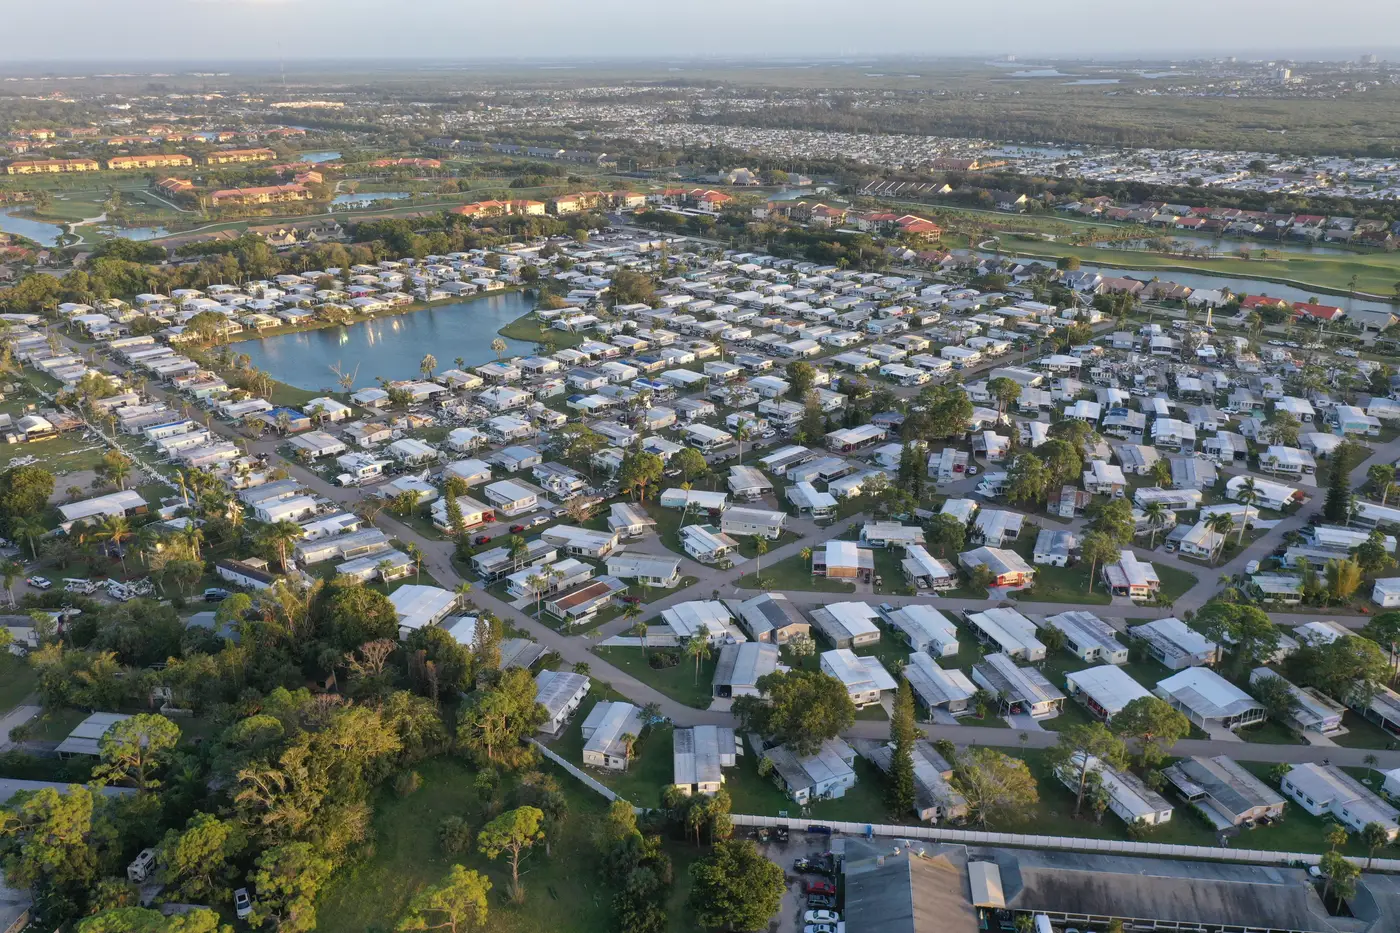 Flagging mobile home parks as priority blocks for cooling interventions
How to identify manufactured housing clusters as priority blocks for cooling centers and shade trees using a housing-type heat overlay.
2 Nov 2026
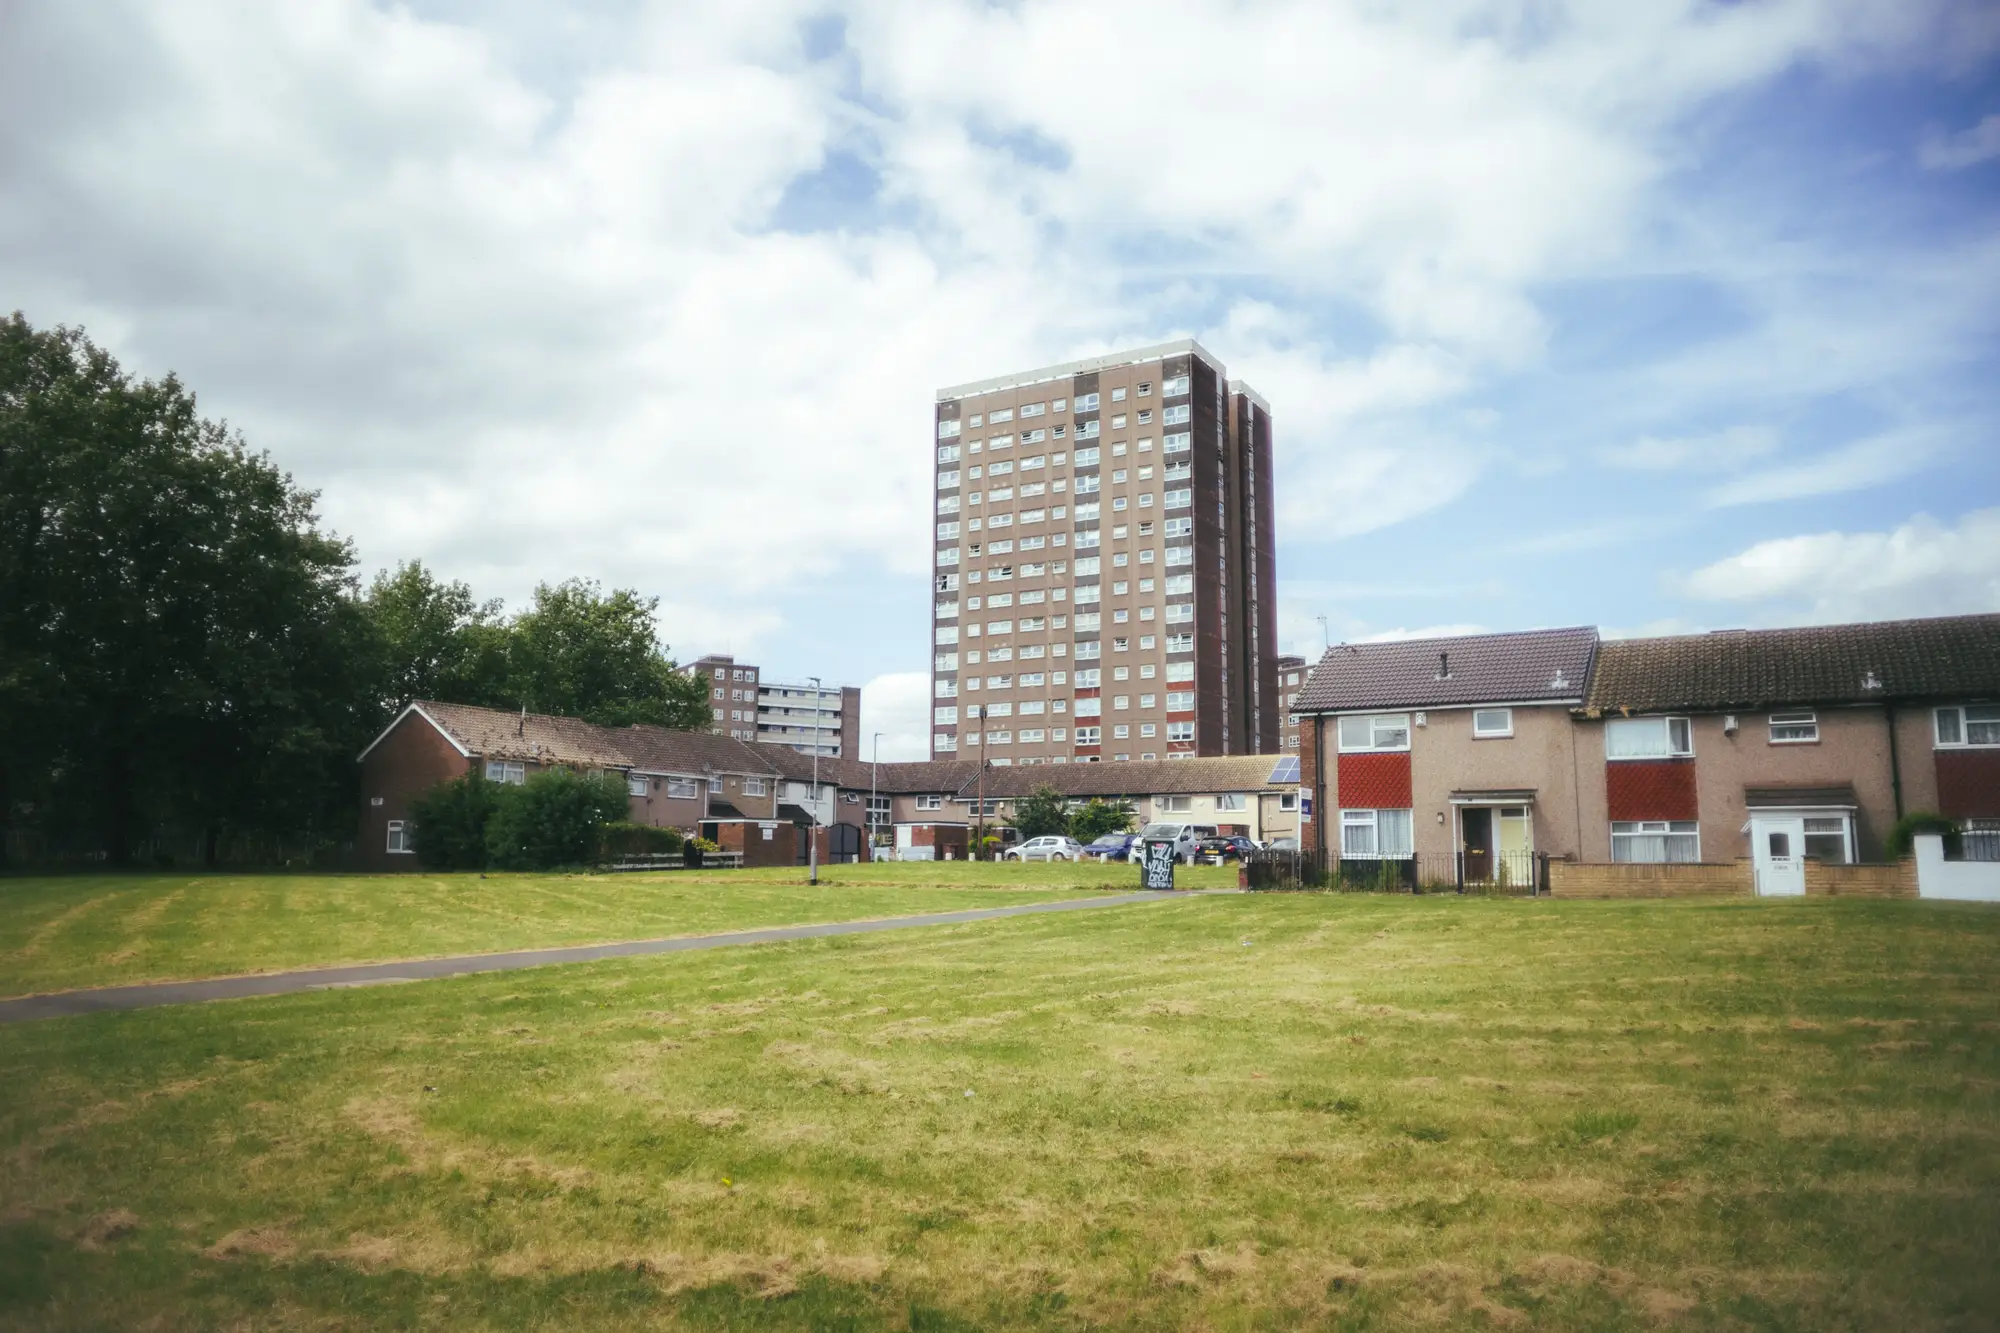 Field notes: the block redlining built hot eighty years ago
A field-notes look at why decades-old HOLC redlining maps still predict which city blocks run hottest today.
2 Nov 2026
How to overlay the CDC social vulnerability index with a block-level heat mapA step-by-step look at joining CDC SVI tract data with block-level surface temperature to find where heat risk and vulnerability overlap.
26 Oct 2026
How to layer building type data onto a block-level heat mapA practical walkthrough for joining parcel and assessor building-type data to block-level surface temperature, so cooling dollars land where they're needed.
26 Oct 2026
What is a cooling center catchment area, and how do you map it?A plain explainer on cooling center catchment areas, walk distance versus radius buffers, and how to check them against the blocks that run hottest.
19 Oct 2026
Field notes: the block that ran hot on the map and mild on the groundA thermal hot spot that turned out mild on foot: why land surface temperature and block-level heat exposure aren't the same reading.
19 Oct 2026
Heat dome vs. urban heat island: what sets them apartHeat domes are weather. Urban heat islands are built environment. Here's the difference and why it matters for block-level cooling plans.
14 Oct 2026
How often should block-level heat data refresh between seasonsHow often block-level surface temperature data should refresh between cooling seasons, and what changes if you wait too long.
14 Oct 2026
Multispectral vs. thermal-only imagery: what actually tells you which block needs shadeA planner's guide to why a single thermal band isn't enough for block-level heat targeting, and what multispectral imagery adds.
13 Oct 2026
Day vs. night land surface temperature: which matters more for cooling center sitingDay LST shows what's hot at 2pm. Night LST shows who never gets relief. Here's which one should drive cooling center placement.
13 Oct 2026
What counts as a heat-vulnerable blockA plain breakdown of the indicators that flag a heat-vulnerable block, not just a hot one, for planners siting cooling investment.
7 Oct 2026
How many degrees cooler do shade trees make a city block?What urban forestry research says about tree canopy cooling, and why the answer changes block by block depending on surface type and canopy gaps.
7 Oct 2026
How to site a cooling center using heat and demographic dataA practical guide to cooling center placement criteria that combines surface temperature, housing stock and demographic density at the block level.
7 Oct 2026
Land surface temperature vs. air temperature, explainedWhy a thermal satellite reads a roof at 118°F when the forecast says 91°F, and what that gap means for siting cooling investment by block.
7 Oct 2026
What is a heat vulnerability index? A block-level primerWhat a heat vulnerability index measures, what goes into the score, and why block-level scoring beats tract averages for targeting cooling investment.