Field notes: the block redlining built hot eighty years ago
There's a particular kind of quiet when you lay a 1937 HOLC map over a current thermal pass of the same city. The boundaries don't move. That's the part that gets me every time.
The Home Owners' Loan Corporation drew those maps between 1935 and 1940, grading neighborhoods from A (green, "best") down to D (red, "hazardous") for mortgage lenders. The grading had nothing to do with soil or drainage or housing stock condition, not really. It had to do with who lived there. Redlined districts got starved of investment for decades: no loans, no renovation capital, no reason for a landlord to plant a tree or widen a sidewalk median. Greenlined districts got the opposite. Investment follows the path of least resistance, and for eighty years the path avoided the red.
I've run this overlay enough times now to stop being surprised and start taking notes instead.
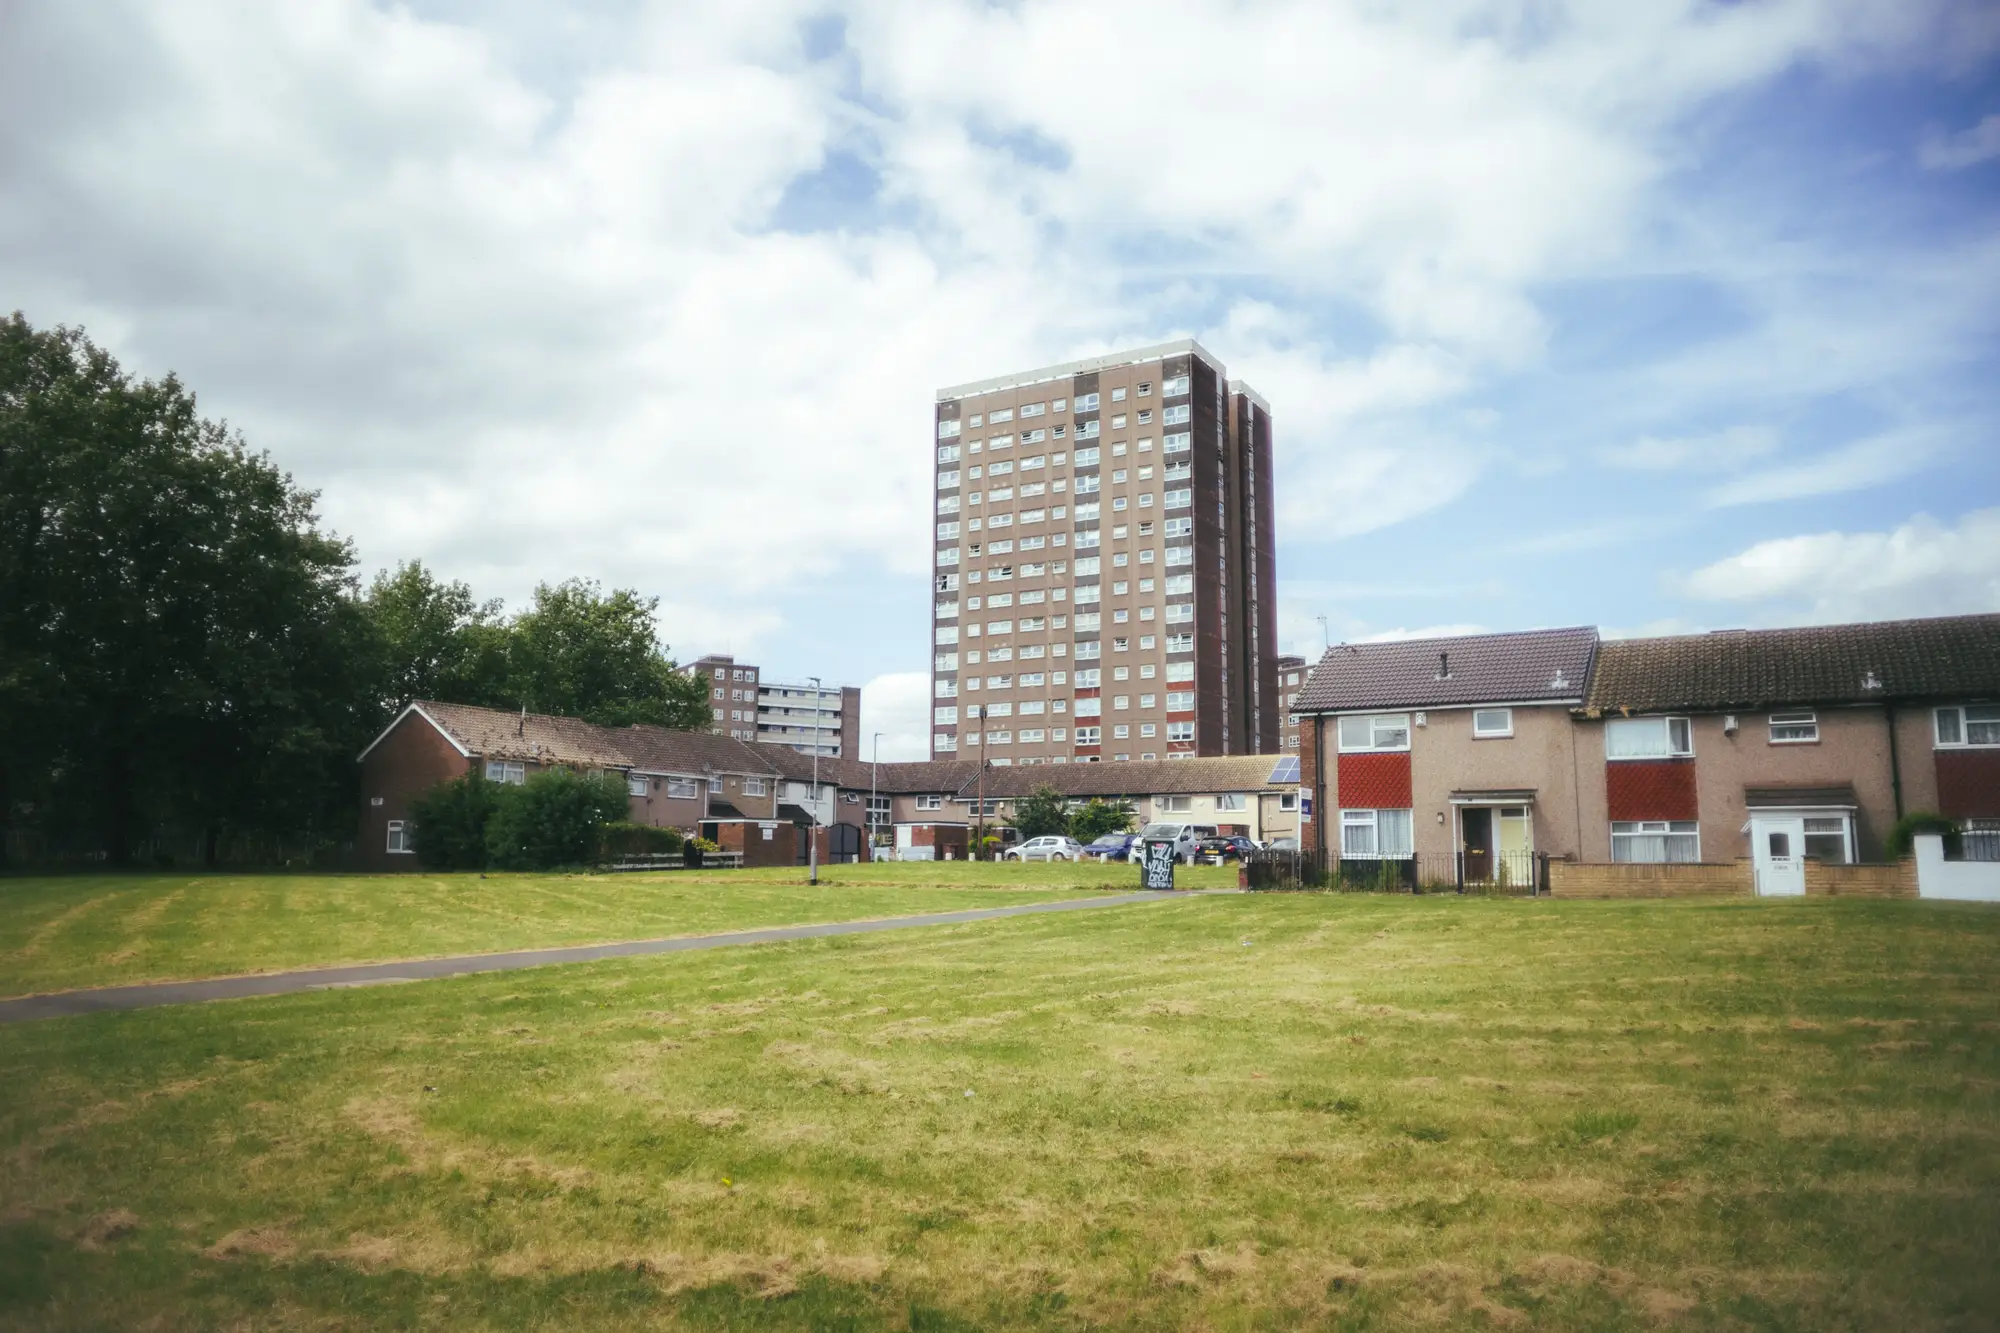
What you see, consistently, is that the old D-grade boundaries show up again in the thermal band, and it isn't a coincidence of geography. Pull the multispectral capture and look at canopy: the old A and B districts still carry more mature tree cover, wider lots, more pervious surface. The old C and D districts carry more asphalt, more flat dark roofing, denser lot coverage, fewer street trees because there was never a parks budget line for them. The building stock in a lot of these blocks is older too. Brick and masonry built before anyone was thinking about albedo, retrofitted, if at all, with whatever material was cheapest at the time.
None of this required a researcher to go dig up the HOLC scans to find it. It shows up on its own, block by block, every time you run a seasonal thermal pass over a city with a redlining history, which is most American cities over a certain age. The map is historical. The heat is current. Lay them side by side and the line between them is the same line.
What strikes me as a planner isn't the correlation itself. People in this field have known about it for years now; it's been documented city after city. What strikes me is how block-specific the fix has to be, and how block-blind the funding usually is. A city council allocates a cooling-centers budget or a shade-tree grant program citywide, divided by ward or by population, and the blocks that carry the worst exposure (the ones sitting on that old red line, with the oldest roofing, the least canopy, and often the highest share of residents without reliable AC) get the same per-capita slice as a block three miles away with a tree-lined boulevard and newer construction. The money is aimed at the wrong resolution, spread by ward when the heat sits by block.
The overlay work on this site stacks surface temperature, building type, and demographic density at the block level, so a shade-tree or cooling-center dollar lands on the block that's actually running hot and short on relief. Right now too many of these budgets spread evenly across a map that was never evenly hot to begin with. You can see what that looks like for your own city on the Heat Exposure Mapping home page.
A few things worth flagging if you're doing this kind of overlay yourself. HOLC maps aren't perfectly geocoded by modern standards, so expect some edge-matching work at the boundary lines. Thermal signal from a single summer pass can get noisy around construction sites and large parking lots, so a seasonal cadence rather than a single snapshot gives you a cleaner read. And demographic density data lags behind building change, so pair it with the most recent housing stock you can get rather than assuming it's static.
Eighty years is a long time for a mortgage map to keep doing its work. If your cooling budget is still being handed out by ward instead of by block, it's worth seeing where your city's own red lines line up with this summer's heat.