field notes: the block that cooled four degrees and nobody noticed until the data did
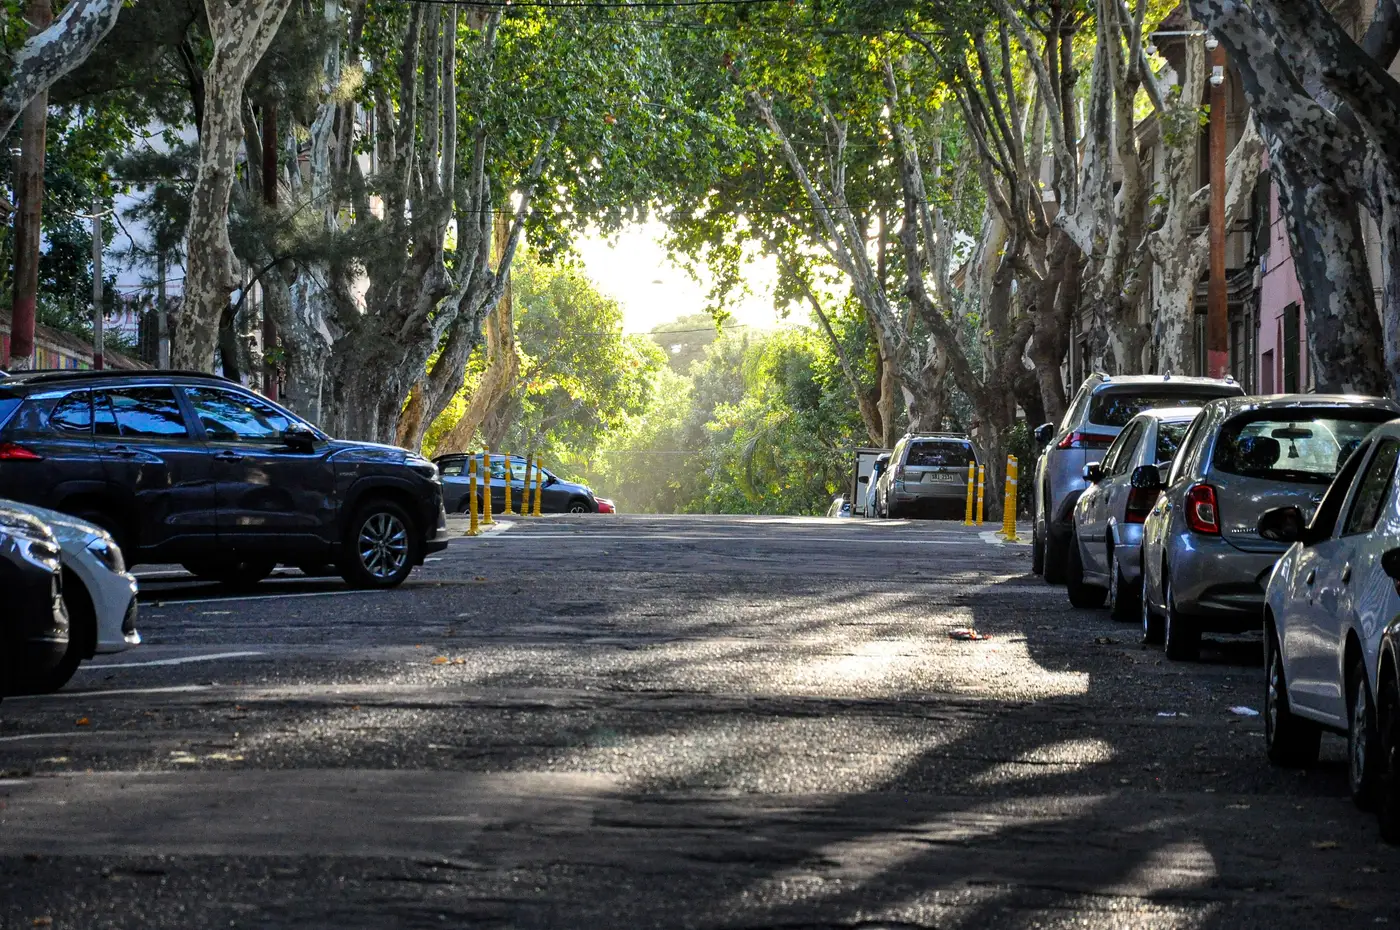
There's a pattern that shows up often enough in block-level thermal data that it deserves a name, even if nobody's agreed on one yet. Call it the quiet block. A stretch of six or eight parcels that was running hot for years, flagged on every vulnerability overlay, never scheduled for anything, and then one season it just isn't hot anymore. Nobody filed paperwork. No press release went out. The surface temperature just dropped, and the only reason anyone caught it was because the seasonal pass happened to cover that block again and the numbers didn't match the baseline.
Dig into one of these and the cause is rarely dramatic. A row of street trees planted five years back for an unrelated streetscape grant finally closed canopy. A property owner reroofed with a lighter membrane because the old one was failing, not because anyone asked for albedo. A parking lot got subdivided and half of it became a pocket park nobody budgeted heat-relief dollars for. None of it shows up in a capital plan as a cooling intervention, because nobody framed it as one. It shows up as a drop in land surface temperature on a block that used to sit two to four degrees above its neighbors and now doesn't.
Most heat-vulnerability work runs on a fixed interval: assess, rank, fund, revisit in three or five years. In between revisits, the ranking stays frozen while the ground keeps changing. A block that quietly cooled off keeps its old score and keeps absorbing attention it no longer needs as urgently. A block that got hotter, maybe from a lot that lost its tree cover to storm damage or a new flat-roof warehouse going in, keeps the score it had before that happened too. The map is accurate on the day it's made and wrong by the time anyone acts on it, and the gap widens every month past that date.
The fix is seasonal cadence, because the blocks that move tend to move across a single summer. A canopy gap closes over one growing season. A roof gets swapped on whatever schedule the building's maintenance budget dictates, which has nothing to do with a planning cycle. A thermal read taken once a year, or once every few years, catches the quiet block late if it catches it at all, and leaves the block that got worse sitting unflagged for the same stretch of time.
The useful target is narrower than watching the whole city every week: the blocks already sitting near a threshold, tracked closely enough that a four-degree shift in either direction registers before the next funding cycle locks in. That's the actual use case behind overlaying surface temperature against building stock and demographic density by block, rather than trying to hold every parcel in the city at the same resolution all the time.
None of this is a case for fewer site visits or less local knowledge. A canopy survey from a bucket truck still tells you things a thermal band can't, like which trees are stressed and won't make it another drought year. But the bucket truck can't cover four hundred blocks in a week, and the thermal pass can tell you which forty of those blocks moved since last summer so the bucket truck knows where to go first.
If your vulnerability rankings are more than a season old, it's worth checking whether any of your hot blocks have gone quiet on their own, and worth seeing which ones haven't. Heat Exposure Mapping's seasonal passes are built to catch exactly that kind of move before the next budget cycle locks it out.