Field notes: the block that ran hot on the map and mild on the ground
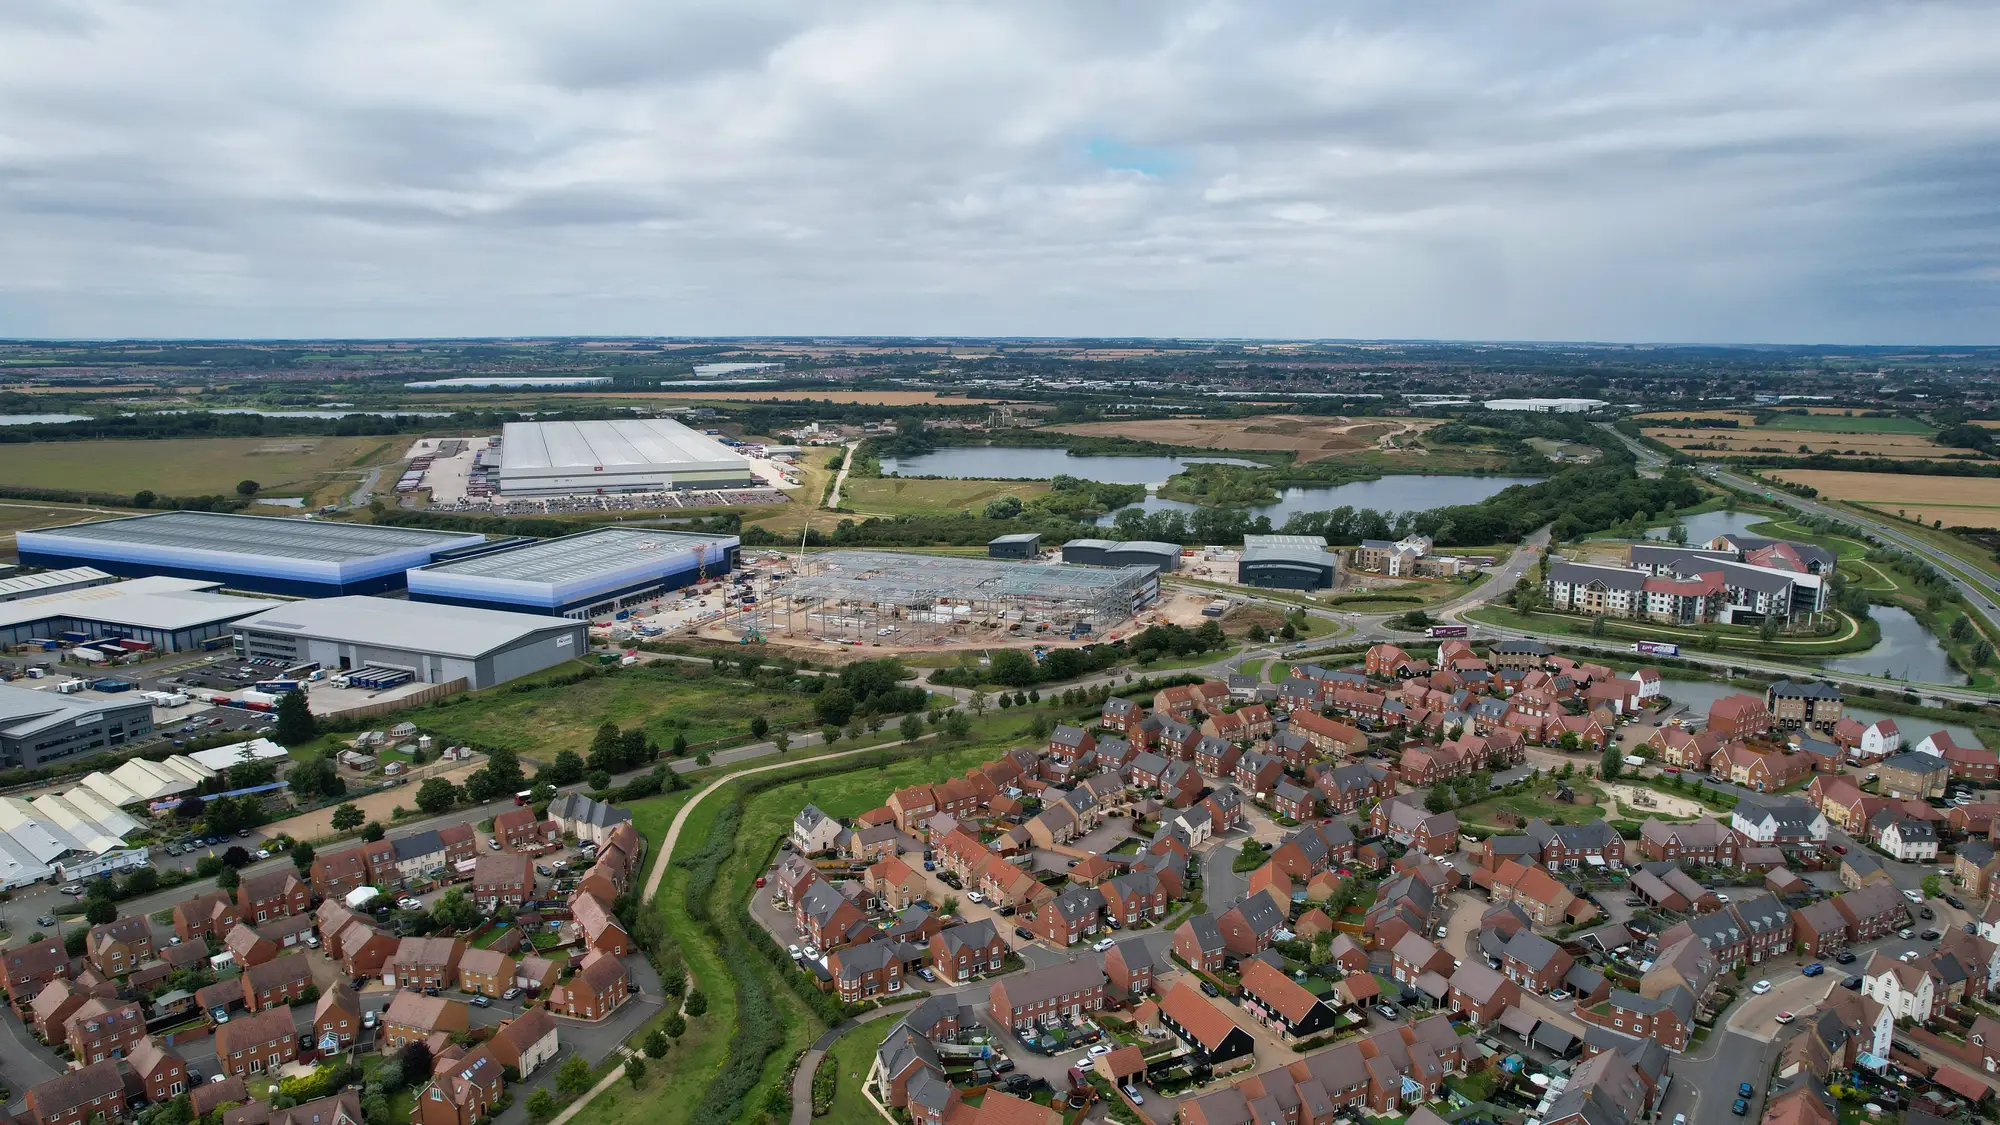
We pulled up a block last month that broke every assumption we walk into these reviews with. On the thermal band, it was near the top of the city's hot list. Flat roofs, a strip of surface parking, almost no canopy in the pixel. Exactly the signature you'd flag for a cooling-centre site or a shade-tree grant.
Then someone on the call who'd walked the block that week said it didn't feel that bad. Shade from the buildings across the street falls on the sidewalk by early afternoon. The parking lot empties out after the morning shift, so nobody's standing on it at 3pm. The block runs hot as a surface. It doesn't run hot as a place people are stuck outside in.
That gap is normal, not a flaw in the imagery. Land surface temperature and what a person standing on a sidewalk feels are two different measurements, and the difference is worth sitting with because it changes how you read a thermal layer.
A satellite pass with a thermal band measures radiant heat coming off whatever's facing up: asphalt, roofing membrane, bare soil, concrete. Dark, dry, impervious surfaces hold and release heat efficiently, so they read hot almost regardless of what's happening at head height. A block with a lot of exposed pavement is going to score hot on that band even if the sidewalks are shaded, the street trees are mature, and the pass itself happens to catch the block at a quiet hour. Surface temperature is real, and it correlates with ambient heat over time. It's not the same measurement as what someone waiting for a bus feels at 4pm in August.
Keep the thermal read, but stack it against what else the imagery shows before you commit a cooling-centre site or a planting budget to a block. Building footprint and roof type tell you how much of that hot surface sits at ground level versus up on a roof nobody stands on. Canopy cover, even sparse canopy, tells you where shade already exists along the sidewalk network rather than just in the aggregate block number. And because the data comes in on a seasonal cadence, you can watch whether a block's surface temperature holds steady across a growing season or spikes and drops with mowing, parking turnover, or construction, which says something about how persistent the exposure actually is.
Demographic density layered on top is what turns a hot pixel into a planning decision. A hot block with a shaded, lightly used parking lot and a low share of outdoor workers or elderly residents is a different priority than a hot block where half the lot is a bus layover and the block houses a senior housing complex two doors down. Both can show the same surface temperature. They are not the same problem.
The block from that call stayed on our list, just lower than its thermal score alone would suggest, and a different block two tracts over moved up once we looked at where its heat sat relative to where people wait, walk, and live. That reordering is the whole point of looking at this block by block instead of citywide. A city-level heat map tells you it's a hot summer. It doesn't tell you which forty feet of sidewalk needs a tree.
That's the kind of read our overlay of surface temperature, building type, and demographic density is built to support, block by block rather than city-wide. If you're scoping cooling-centre or shade-tree investment for next season, it's worth a look.