How many degrees cooler do shade trees make a city block?
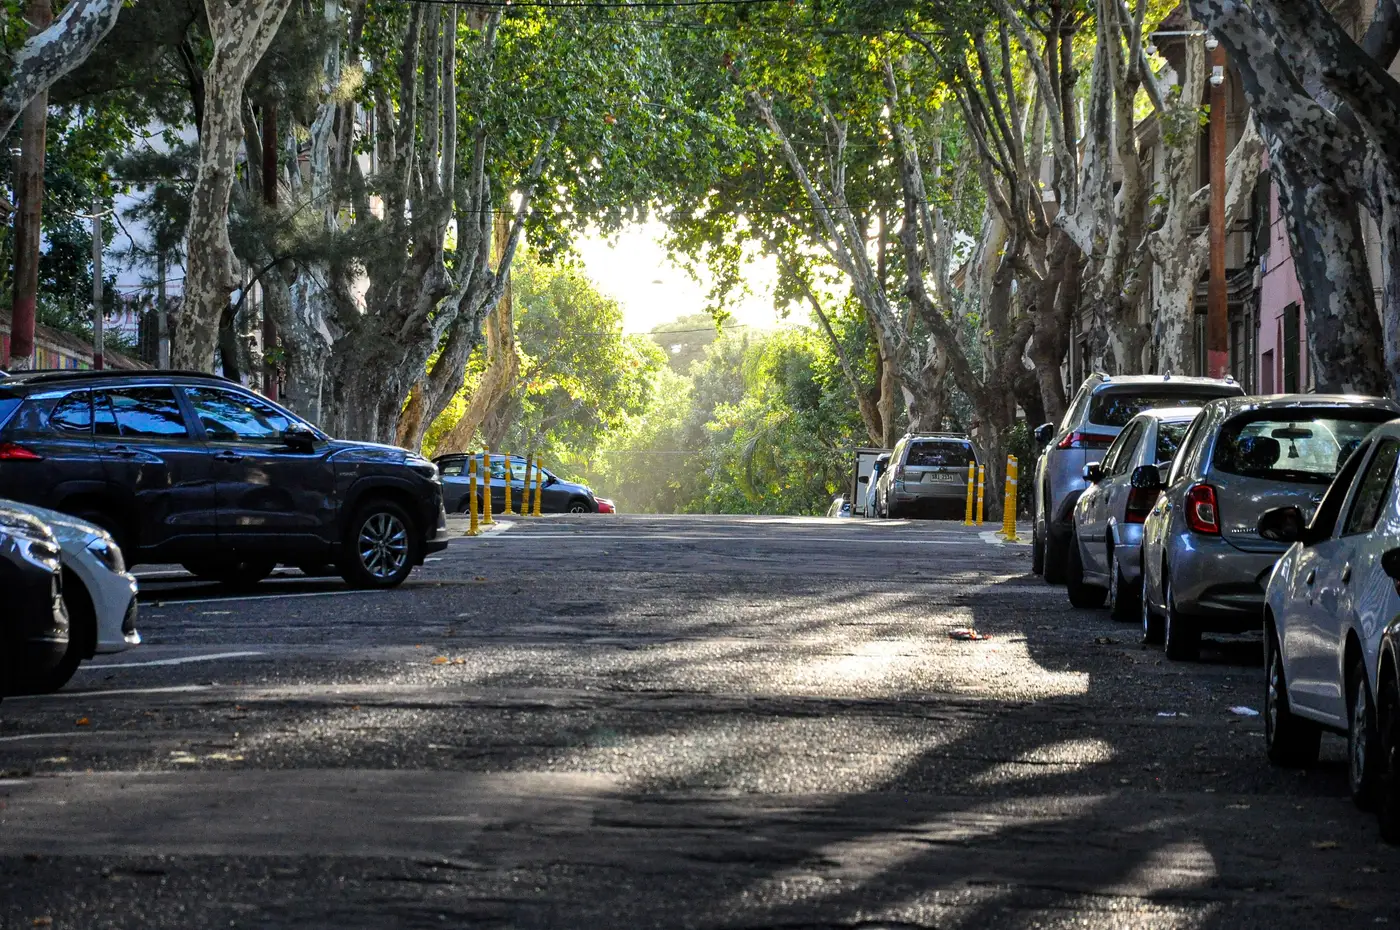
A mature street tree canopy can drop air temperature under it by roughly 2 to 9 degrees Fahrenheit compared to open pavement nearby, according to the ranges most often cited in US Forest Service and EPA heat island research. Surface temperature differences run much higher. A shaded asphalt parking lot can measure 20 to 45 degrees cooler than the same lot in full sun at 3 p.m. in July.
Those are the numbers planners quote in grant applications. They're also the numbers that get misapplied, because a citywide average tells you almost nothing about what happens on Block 14 versus Block 15.
Why the range is so wide
Canopy cooling depends on what's underneath it and around it. A tree standing over a dark asphalt lot with buildings blocking airflow on three sides behaves differently than the same species on a block with grass verges and open sightlines to a breeze. Leaf density matters too. A young honey locust with a thin, open crown throws dappled shade. A 40-year-old oak throws near-total shade and holds humidity under it longer into the evening, which changes how the block releases heat after sunset.
Building material plays a role that's easy to underweight. Brick and light-colored concrete radiate stored heat back out for hours after dark. Trees reduce that radiant load during the day by intercepting solar gain before it hits the surface, but a block of unshaded brick rowhouses will still run hot overnight even with trees on the sidewalk, because the thermal mass absorbed heat all afternoon regardless of canopy.
This is the part that matters for siting investment: two blocks with identical canopy percentage can have different surface temperature outcomes depending on pavement type, building height-to-street-width ratio, and how much of the lot coverage is roof versus lawn versus asphalt. Canopy percentage alone, the number most tree-equity maps report, doesn't capture that.
Air temperature versus surface temperature
These get used interchangeably in public meetings and they're not the same measurement. Air temperature is what a thermometer reads at head height, shaded or not. Surface temperature is what a thermal sensor reads off the pavement, roof, or ground surface itself, and it's what drives the heat a pedestrian feels radiating up from the sidewalk at 6 p.m.
Surface temperature is also the number that correlates most directly with where heat-related illness calls cluster, because it tracks the surfaces people stand on, wait on bus benches near, and sleep next to in un-air-conditioned apartments. A tree cools both, but the surface effect is larger and it's the one that shows up clearly in remote sensing imagery, which is part of why surface temperature has become the standard input for siting cooling infrastructure rather than relying on canopy percentage maps alone.
What this means for where you plant
If the goal is reducing heat exposure for the residents most at risk, canopy percentage by neighborhood is a weak proxy. A neighborhood can hit its tree equity target on paper while the three hottest blocks in it, usually the ones with the least canopy and the most impervious surface, see no benefit because the trees went in on blocks that were already cooler to start.
The planning teams getting this right start from a surface temperature layer, not a canopy inventory, and cross it against building footprint and population density to find where a shade tree or a cooling center actually changes conditions for the people living there. Heat Exposure Mapping builds that layer: surface temperature, building type, and demographic density overlaid down to the block, so the blocks that run hottest and house the most heat-vulnerable residents are the ones that show up first on the list.
If you're scoping a canopy or cooling-center investment plan this budget cycle, it's worth seeing your city's blocks ranked that way before you finalize where the trees go.