Flagging mobile home parks as priority blocks for cooling interventions
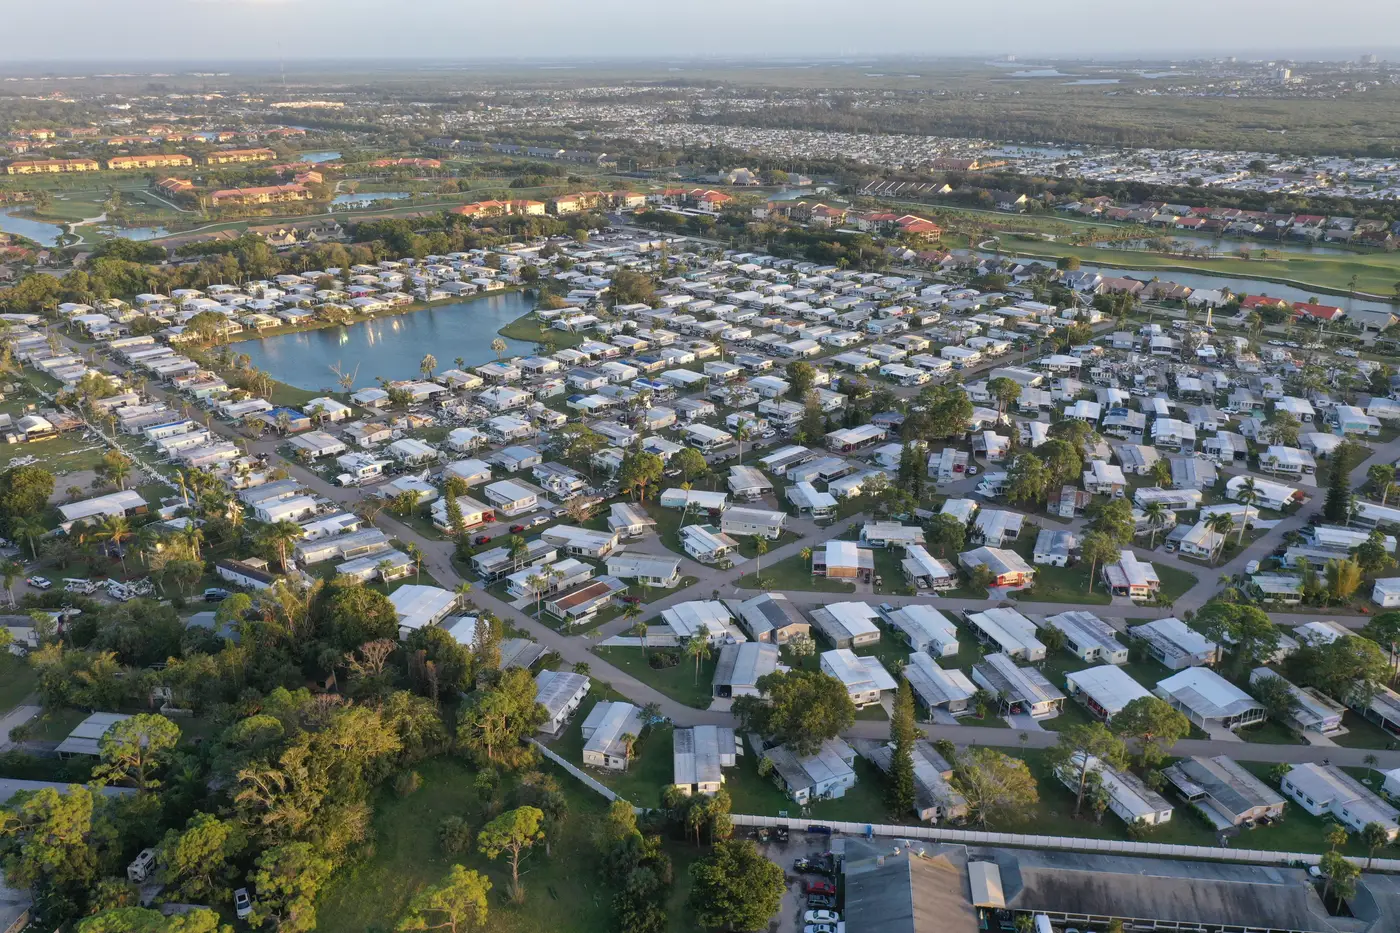
Most heat vulnerability indices score census tracts, not blocks, and they lean on variables like median age and poverty rate. That misses something a lot of environmental health planners already know from windshield surveys: manufactured housing clusters run hotter than the tract average around them, and they often don't show up as a distinct category in the data you're handed.
A metal-roofed single-wide with a dark asphalt pad and no canopy behaves nothing like a brick duplex two blocks over, even if both sit in the same census tract with the same vulnerability score. If your cooling-center siting or shade-tree budget gets allocated by tract, mobile home parks can get averaged into invisibility.
Why manufactured housing runs hotter
A few things stack up on these parcels that don't show up in standard demographic layers:
- Roof and skin materials. Metal roofs and thin-walled construction absorb and re-radiate heat faster than masonry or shingled stick-built homes, so surface temperatures on a park read noticeably warmer in afternoon thermal imagery.
- Pavement-to-canopy ratio. Parks are laid out for pad density, not shade. Access roads, parking pads and gravel lots dominate the footprint, and mature trees are rare because they weren't part of the original site plan.
- Cooling access. Window units are common, central air is not, and older units struggle on the hottest days, right when the building envelope is already working against the residents inside.
- Density of vulnerable residents. Parks skew toward retirees, fixed incomes and households without the cash for a mid-season AC repair. That's exactly the population a cooling-center or shade-tree investment is meant to reach.
None of this requires a survey crew to confirm. It shows up as a thermal signature and a parcel pattern you can pull from existing imagery and housing records, block by block.
Building a housing-type overlay for siting decisions
Overlay three things at the block level instead of one at the tract level:
- Surface temperature. Afternoon thermal readings that show which blocks actually run hot, not which tract they're filed under.
- Building type. A layer that flags manufactured housing and mobile home park footprints as a distinct category, separate from single-family and multifamily stock, so they don't get blended into a tract average.
- Demographic density. Population counts at the block or block-group level, so a hot block with forty units reads differently than a hot block with four.
Stack those three and the manufactured housing clusters that are both hot and dense tend to separate themselves from the rest of the map without much interpretation needed. That's the list you hand to whoever is deciding where the next cooling center goes, or which blocks get the shade-tree planting this budget cycle.
This is the gap Heat Exposure Mapping is built to close. It overlays surface temperature, building type and demographic density across a city so the blocks that run hottest and house the most heat-vulnerable residents surface on their own, mobile home parks included, instead of getting folded into a tract-wide score.
What the siting list should actually tell you
A usable priority list isn't just "here are the hot spots." For cooling-center and shade-tree siting specifically, you want the overlay to answer:
- Which manufactured housing clusters sit furthest from an existing cooling center, by block, not by tract centroid.
- Which parks have the least canopy cover relative to parcel size, since that's where a shade-tree budget does the most good per dollar.
- Which blocks combine high surface temperature with high population density, so a single cooling center or planting project reaches the most residents.
Because the imagery runs on a seasonal cadence, you're not stuck with a one-time read from a hot August afternoon five years ago. You can check whether a park's thermal profile shifted after a canopy planting, or whether a new pad section added last season changed the pavement-to-canopy ratio enough to matter.
Manufactured housing has been an afterthought in a lot of heat planning because the standard data layers weren't built to isolate it as its own category. Flagging it at the block level just means overlaying the right three things instead of one.
If your next cooling-investment cycle needs a block-level list that puts manufactured housing clusters where they belong, on priority, get in touch about Heat Exposure Mapping.