How to layer building type data onto a block-level heat map
A surface temperature raster tells you where a block runs hot. It doesn't tell you who lives there or how their building traps that heat overnight. For targeting cooling centers, shade trees, or weatherization dollars, that second layer, building type, is what turns a thermal map into a priority list.
What "building type" means for this join
Most health departments already have what they need sitting in the assessor's office or the GIS shop: parcel boundaries, land use codes, and building footprints with year-built and unit-count fields. The land use code is the workhorse. It sorts parcels into single-family, multifamily (2-4 unit, 5+ unit), mobile home, institutional, and commercial, usually with enough granularity to split a block into its component building stock.
Year-built matters almost as much as use code. A 1920s three-flat with no central air behaves differently under a heat dome than a 2015 apartment complex with rooftop units, even if both get flagged as "multifamily" in the land use table. If your assessor data carries a construction year or a building condition score, keep it in the join. It's often the field that explains why two blocks with identical surface temperatures need different interventions.
Why multifamily and single-family blocks read differently
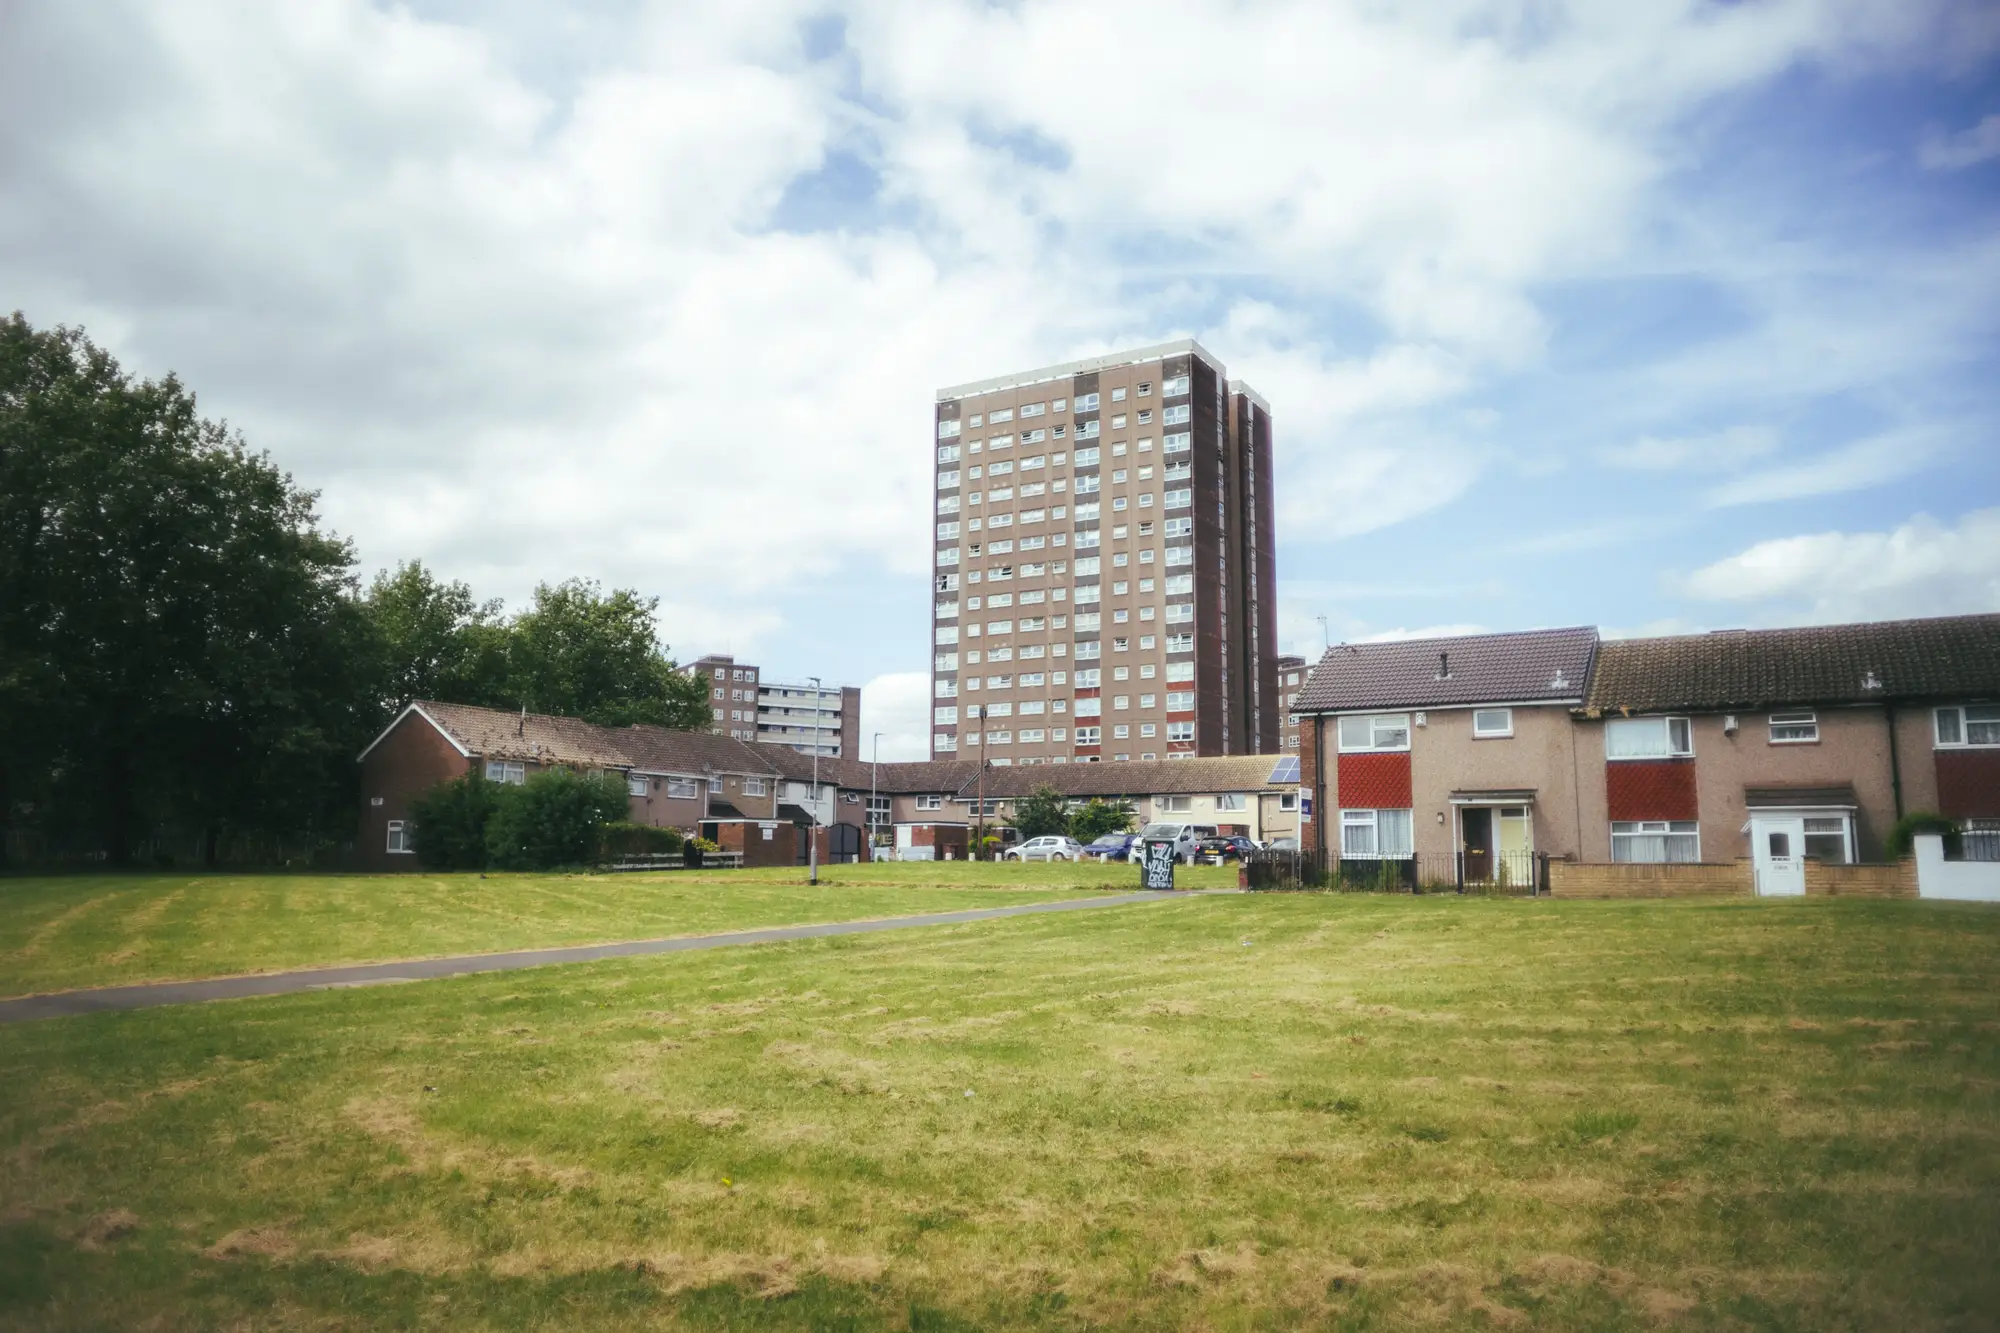
A single-family block with mature street trees and detached homes dissipates heat differently than a block of three-story walkups with asphalt lot coverage and shared mechanical systems. Roof area per resident is lower in multifamily buildings, which sounds like an advantage until you account for unit density: more people are sharing that roof's thermal mass, and in older buildings, more units are running window units (or nothing) instead of central air.
Renter-occupied multifamily parcels also tend to have less control over building-level fixes. A homeowner can plant a tree or get a rebate for a reflective roof. A renter in a 40-unit building is waiting on a landlord or a building authority to act, which is exactly the kind of block where a cooling center or a public shade investment does more good per dollar than an incentive program aimed at individual residents.
This is the comparison a lot of city heat plans skip. They map surface temperature against income or age, which is useful, but they miss that two low-income blocks with the same median income can need completely different interventions if one is single-family bungalows and the other is a strip of garden apartments with no canopy.
Doing the join
Doing this is a standard spatial join that most GIS shops handle routinely:
- Pull your building footprint or parcel layer with land use code, unit count, and year-built fields.
- Aggregate your thermal raster to block or block-group level, since footprint-level temperature noise isn't meaningful at the building scale with most public thermal data.
- Spatially join the block-level temperature value to each parcel, then summarize back up to the block: share of units in multifamily structures, median year-built, dominant land use code.
- Cross-tab block temperature percentile against building type share. The blocks that land in the top heat percentile and have a majority multifamily, pre-1980 housing stock are usually your first list for cooling center siting.
Demographic density data, how many people actually live on each block, is the third layer most plans need alongside this. Unit count alone won't tell you whether a multifamily block is full of families with small children or mostly single occupants.
None of this requires new fieldwork. It's a desk exercise if you already have the parcel data and a seasonal thermal source to join it against. The harder part, usually, is keeping the layers current as new construction and land use changes come in, and making sure the thermal input is recent enough that last year's shade tree planting shows up in the numbers.
Heat Exposure Mapping already runs this join as a standing overlay, pairing seasonal surface temperature against building type and demographic density by block so the building-type layer doesn't have to be rebuilt by hand every planning cycle. If prioritizing a cooling-center or shade-tree list by block and building type is on your plate this season, that's worth a look.