What counts as a heat-vulnerable block
Every city has blocks that read hot on a thermal layer. Far fewer of those blocks are vulnerable in the way that matters for siting a cooling centre or a shade-tree budget. The distinction trips up a lot of otherwise solid heat plans, so it's worth being precise about what the term should mean when you use it in a funding application or a council memo.
A heat-vulnerable block is one where high surface temperature overlaps with people who have fewer ways to cope with it. Drop the overlap and you're just mapping asphalt.
The three things you're layering
Surface temperature is the starting point, and it's the easiest layer to get right because it comes straight off a thermal band. But a parking lot that bakes all afternoon with nobody living nearby doesn't need a cooling centre. It needs a tree, maybe, for the people walking through it. The vulnerability question only shows up once you add who's there and what they're living in.
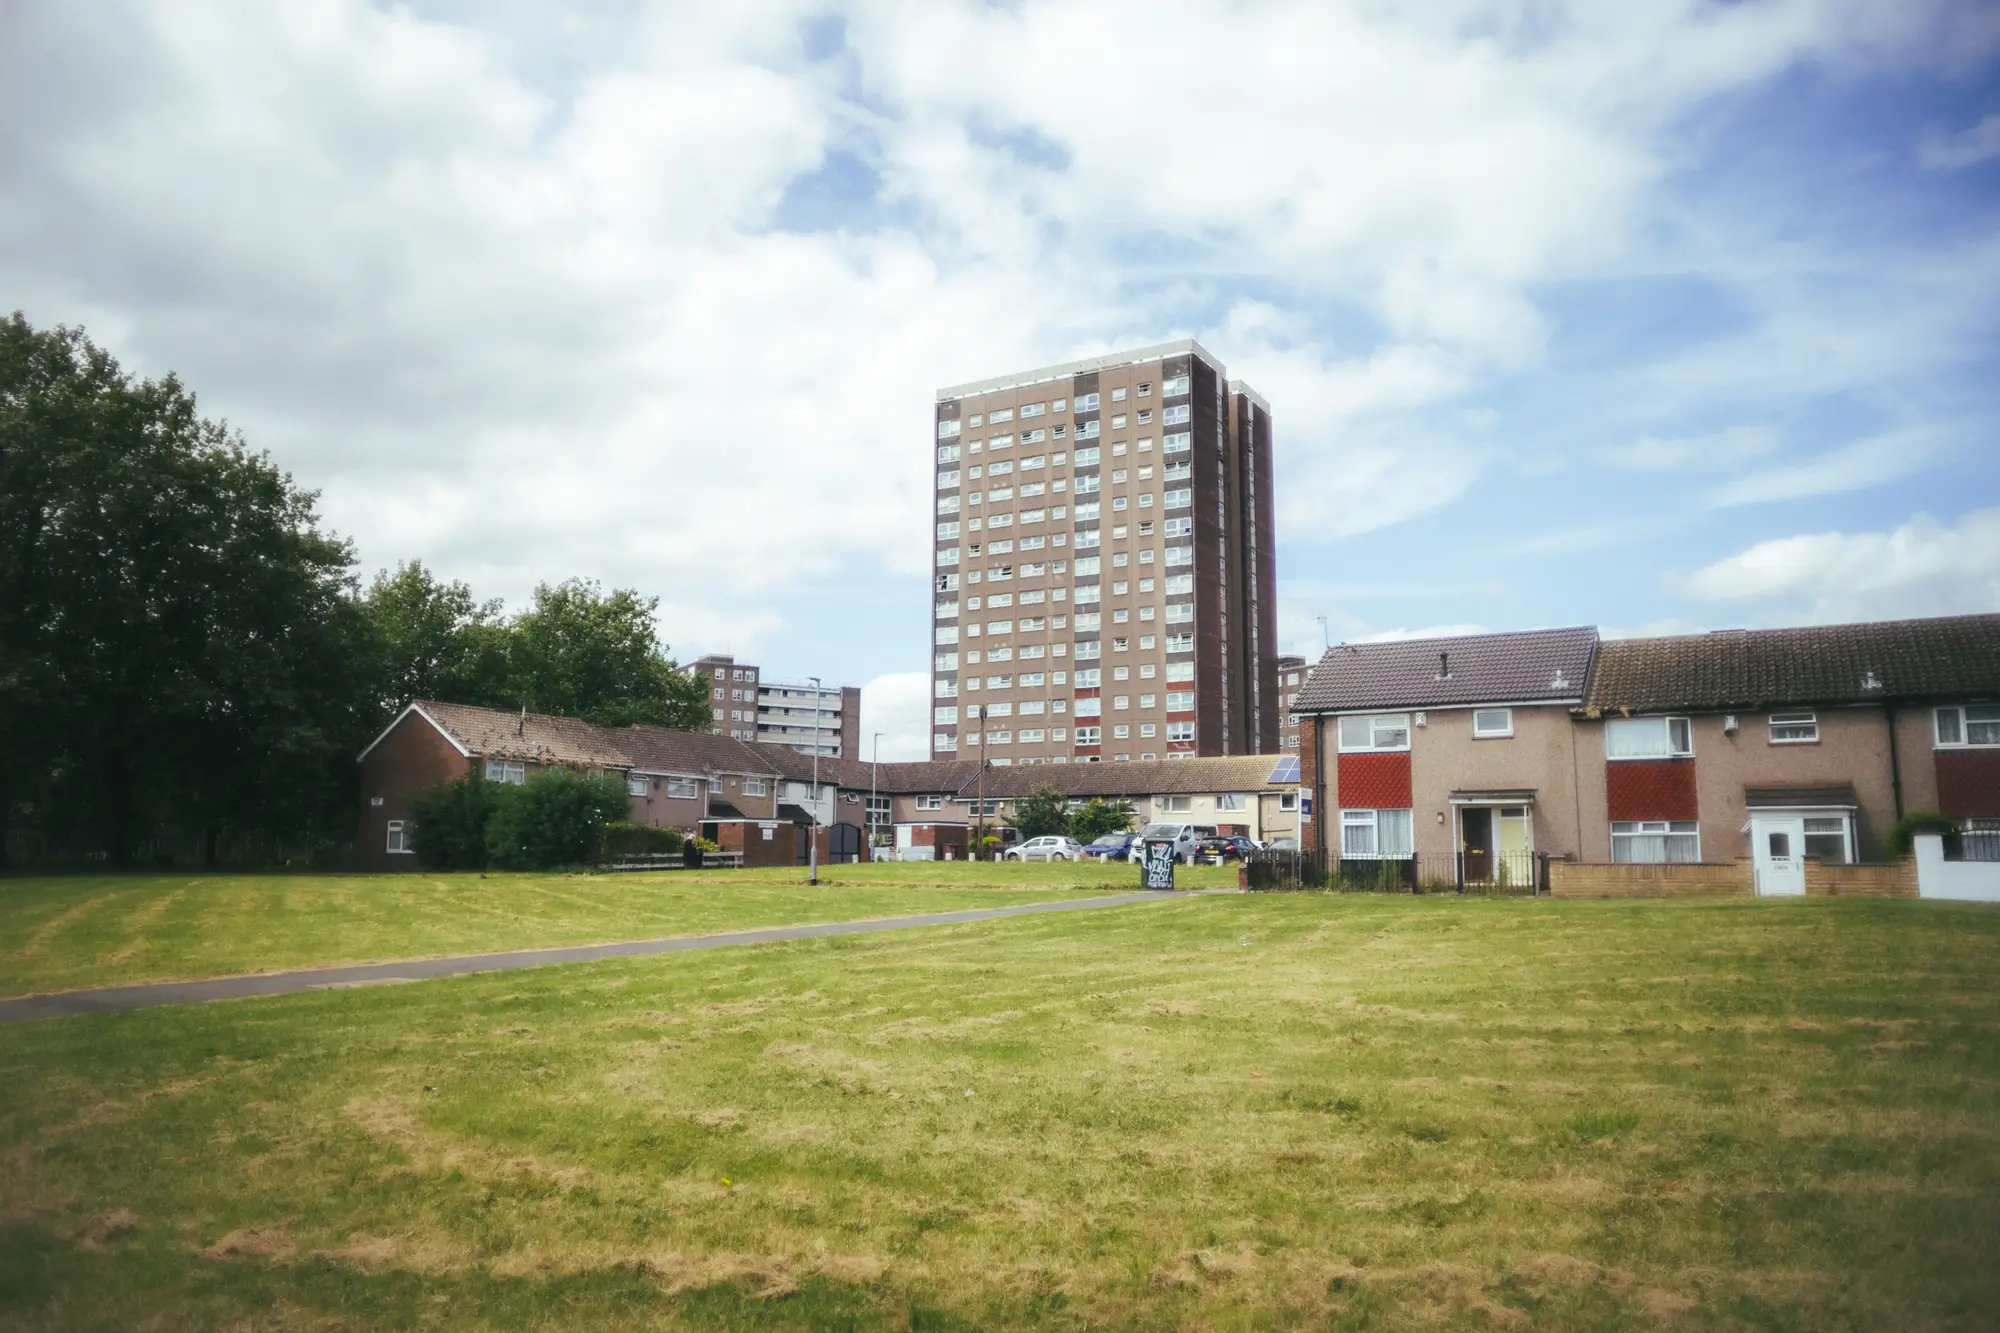
Building type does a lot of the work that people skip. A block of 1960s brick walk-ups with no central air behaves completely differently from a block of newer construction with central systems, even at the same surface temperature. Walk-ups retain heat overnight in a way that single-family homes with yards generally don't. Night-time temperature is often the number that matters for health outcomes, not the 3 p.m. peak, because bodies don't get a break to recover.
Demographic density is the layer planners reach for last, and it's the one that actually decides whether a block belongs on the cooling-investment list. The indicators worth pulling, in roughly the order they tend to matter:
- Share of residents 65 and older, especially those living alone
- Households without a vehicle, which limits reaching a cooling centre that isn't walkable
- Rate of chronic respiratory or cardiovascular conditions in the tract, where that data is available
- Housing density per block, since a crowded block puts more residents within reach of the same heat load
- Tree canopy cover, which is really an inverse indicator: its absence is what lets surface temperature climb in the first place
None of these indicators means anything alone. A block can score high on elderly population and still not be a priority if canopy cover is already good and the housing stock keeps units cool. A block can run hot and still not be a priority if it's mostly warehouses. The overlap, examined block by block, is where the real answer sits.
Where this goes wrong in practice
The most common mistake is working at the census tract instead of the block. Tracts average out exactly the variation you're trying to find. A tract can look moderate on every indicator while containing two blocks that are genuinely dangerous and four blocks that are fine, and the moderate average hides both. If your cooling-centre siting decision is being made off tract-level data, you're probably missing the blocks that need it most and catching some that don't.
The second mistake is treating this as a one-time map. Surface temperature shifts with canopy loss, new construction, and even paving changes, and it shifts seasonally. A block that was fine two summers ago can flip after a lot was cleared for a development that hasn't broken ground yet. Vulnerability indicators tied to population also drift as a block ages or turns over. A heat-vulnerable block list built once and never refreshed is a snapshot pretending to be a plan.
The third mistake, and probably the costliest one for a budget that doesn't stretch far, is spending shade-tree dollars on the hottest block in the city rather than the hottest block with the most vulnerable residents behind the doors. Those are frequently different blocks, which is exactly why demographic density gets layered onto the temperature read instead of just chasing the thermal max.
If you're building this kind of block-by-block overlay for your own city, Heat Exposure Mapping lays surface temperature, building type and demographic density over the same grid so the blocks that meet the definition above are the ones that surface first.
Get in touch to see how this overlay could work for your next cooling-investment cycle.