Heat dome vs. urban heat island: what sets them apart
A heat dome shows up in the forecast. An urban heat island shows up on a thermal camera, in July, in the same ten blocks, every single summer. People mix the two terms up constantly, and in a planning context that mix-up costs real money, because the two problems call for different responses at different scales.
What a heat dome is
A heat dome is a weather pattern. A ridge of high pressure parks itself over a region and pushes warm air down, where it gets compressed and heats up further. The high pressure also blocks clouds and storms from moving through, so there's nothing to break up the heat for days, sometimes close to two weeks. This is a synoptic-scale event. It covers hundreds or thousands of square miles and doesn't care about city limits, county lines, or zoning maps.
When meteorologists say a heat dome is forming, they're describing something that will raise the baseline temperature for your entire region, rural and urban alike. A heat dome over your state pushes the farmland fifty miles outside the city into the 100s right alongside downtown.
What an urban heat island is
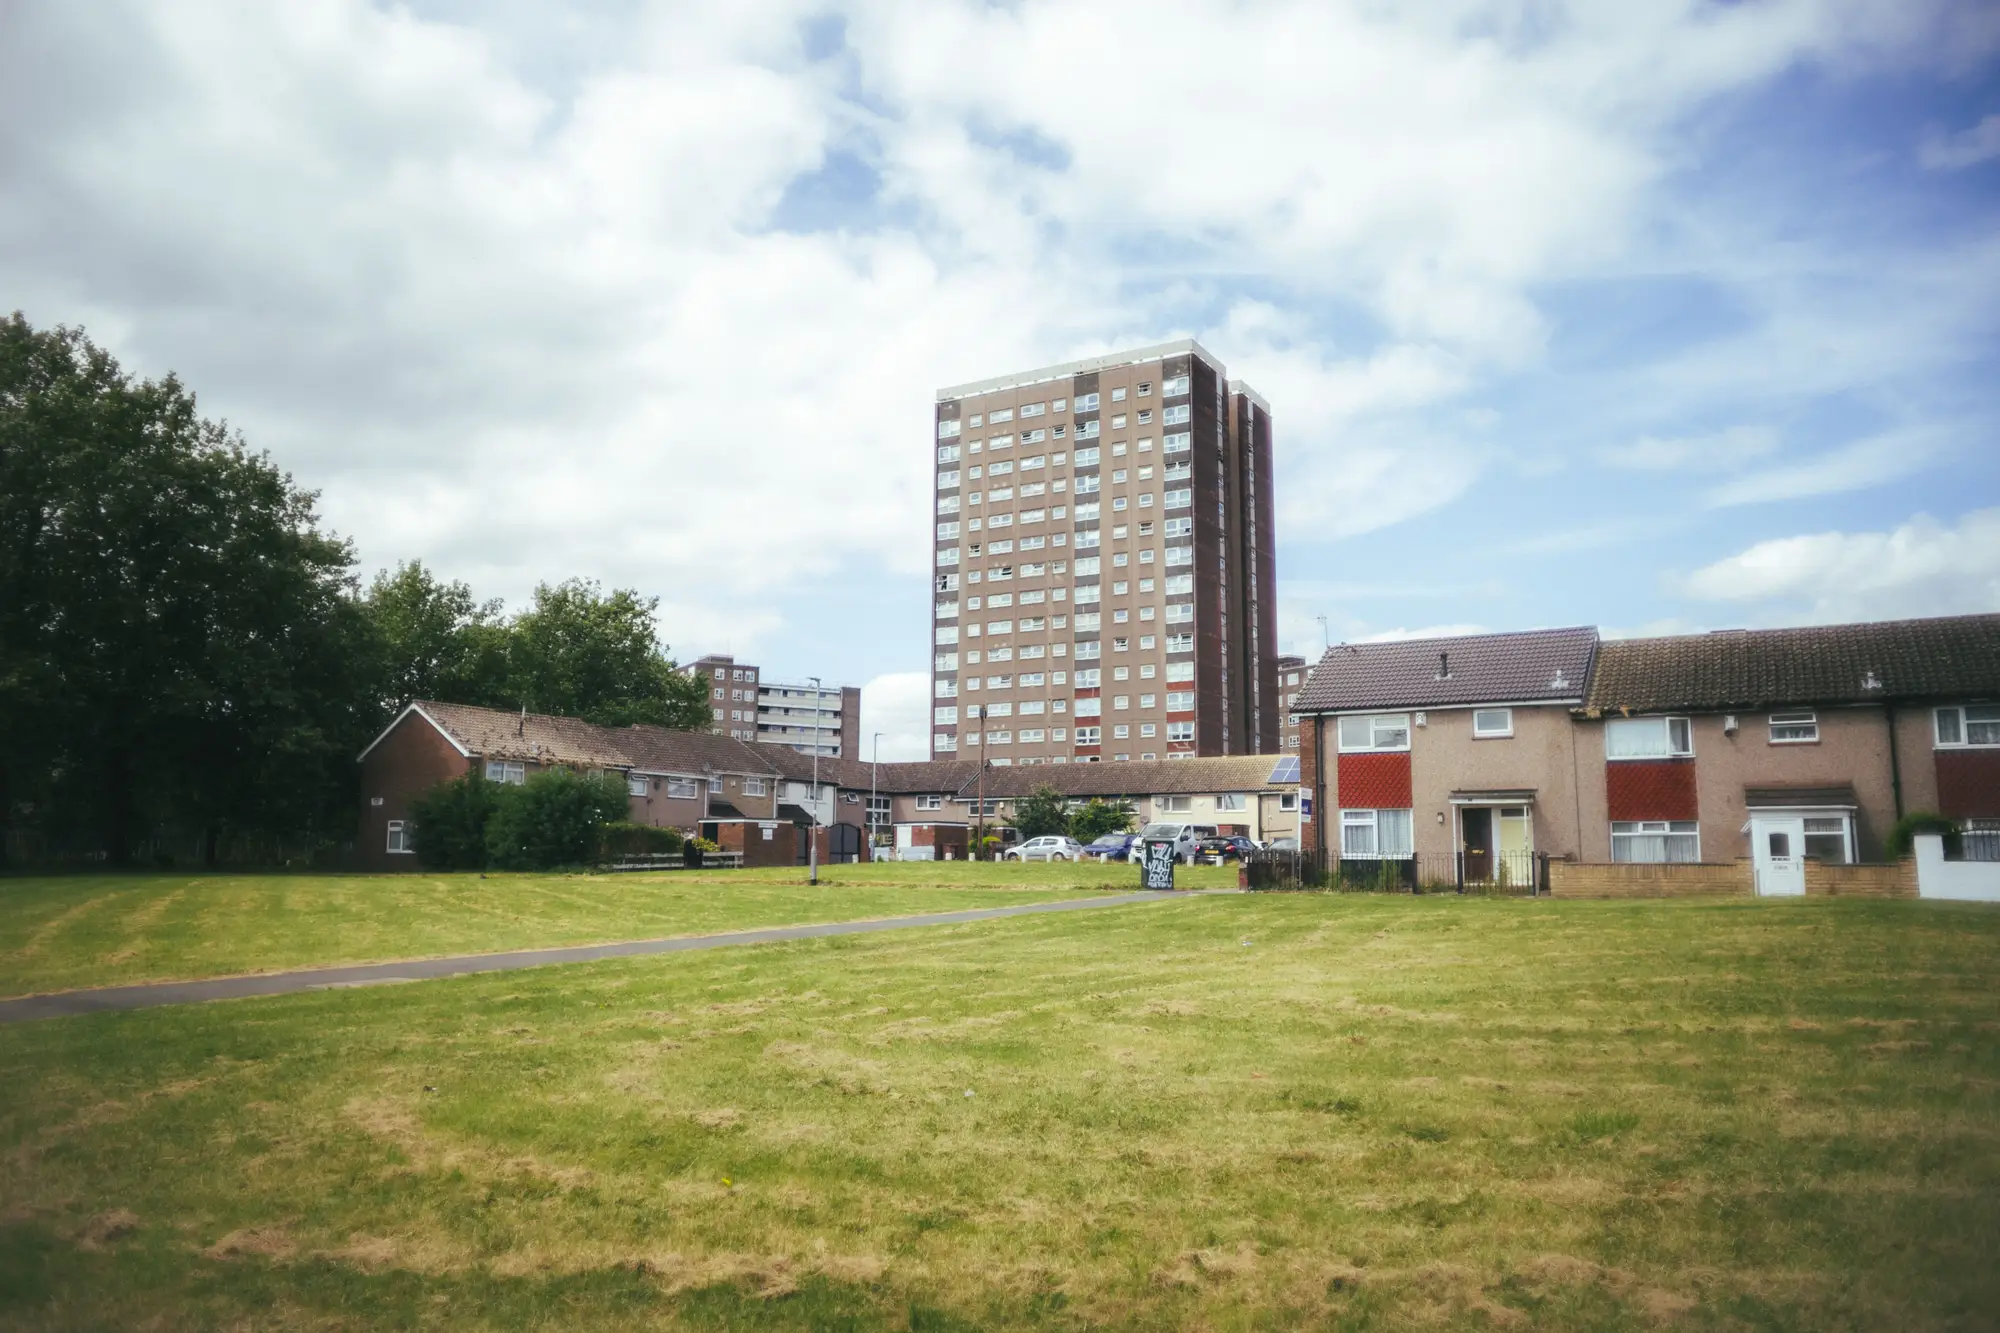
An urban heat island comes from what got built on the ground, not from the atmosphere above it. Asphalt, dark roofing, concrete, and a lack of tree canopy absorb solar radiation during the day and release it slowly after sunset. A surface parking lot and a shaded park a quarter mile apart can differ by double digits in surface temperature on the same afternoon, under the exact same sky.
This is why the urban heat island effect gets described, correctly, as hyperlocal. It doesn't move in from outside your jurisdiction the way a heat dome does. It's baked into the pavement ratio, the building density, and the canopy coverage of each block, and it's there every warm season regardless of whether a heat dome ever forms that year.
Where the two interact, and why it matters for your blocks
Here's the part that affects cooling-center siting and tree planting budgets: a heat dome and an urban heat island stack on top of each other. The heat dome sets the regional floor. The urban heat island determines how much hotter specific blocks run above that floor, and which residents are sitting in them after dark with no relief, because heat islands keep nighttime lows elevated too. Overnight recovery is often where the real health risk lives, not the daytime peak.
A heat dome is a five-day forecast event you can warn people about ahead of time. An urban heat island is a standing condition on a dozen specific blocks in your district, there whether or not a heat dome ever rolls through this year. Treating the two as the same problem means you either over-prepare the whole city for something concentrated in a handful of census blocks, or you under-prepare those same blocks because the citywide forecast looked mild.
This is the gap between knowing it's going to be hot this week and knowing which rowhouse block, which stretch of surface parking, and which senior housing complex are going to run 15 degrees hotter than the park three blocks over, with residents who have no AC and no shade to walk under on the way to a cooling center. Heat Exposure Mapping layers surface temperature readings against building type and demographic density so that question gets answered at the block, not the zip code.
A heat dome tells you this week is dangerous. A heat exposure map tells you which blocks in your district were already dangerous before the forecast ever mentioned a dome, and will be again the next time one comes through. If you're deciding where the next cooling center or shade-tree planting goes, that's the layer worth starting from.